Survey results summary
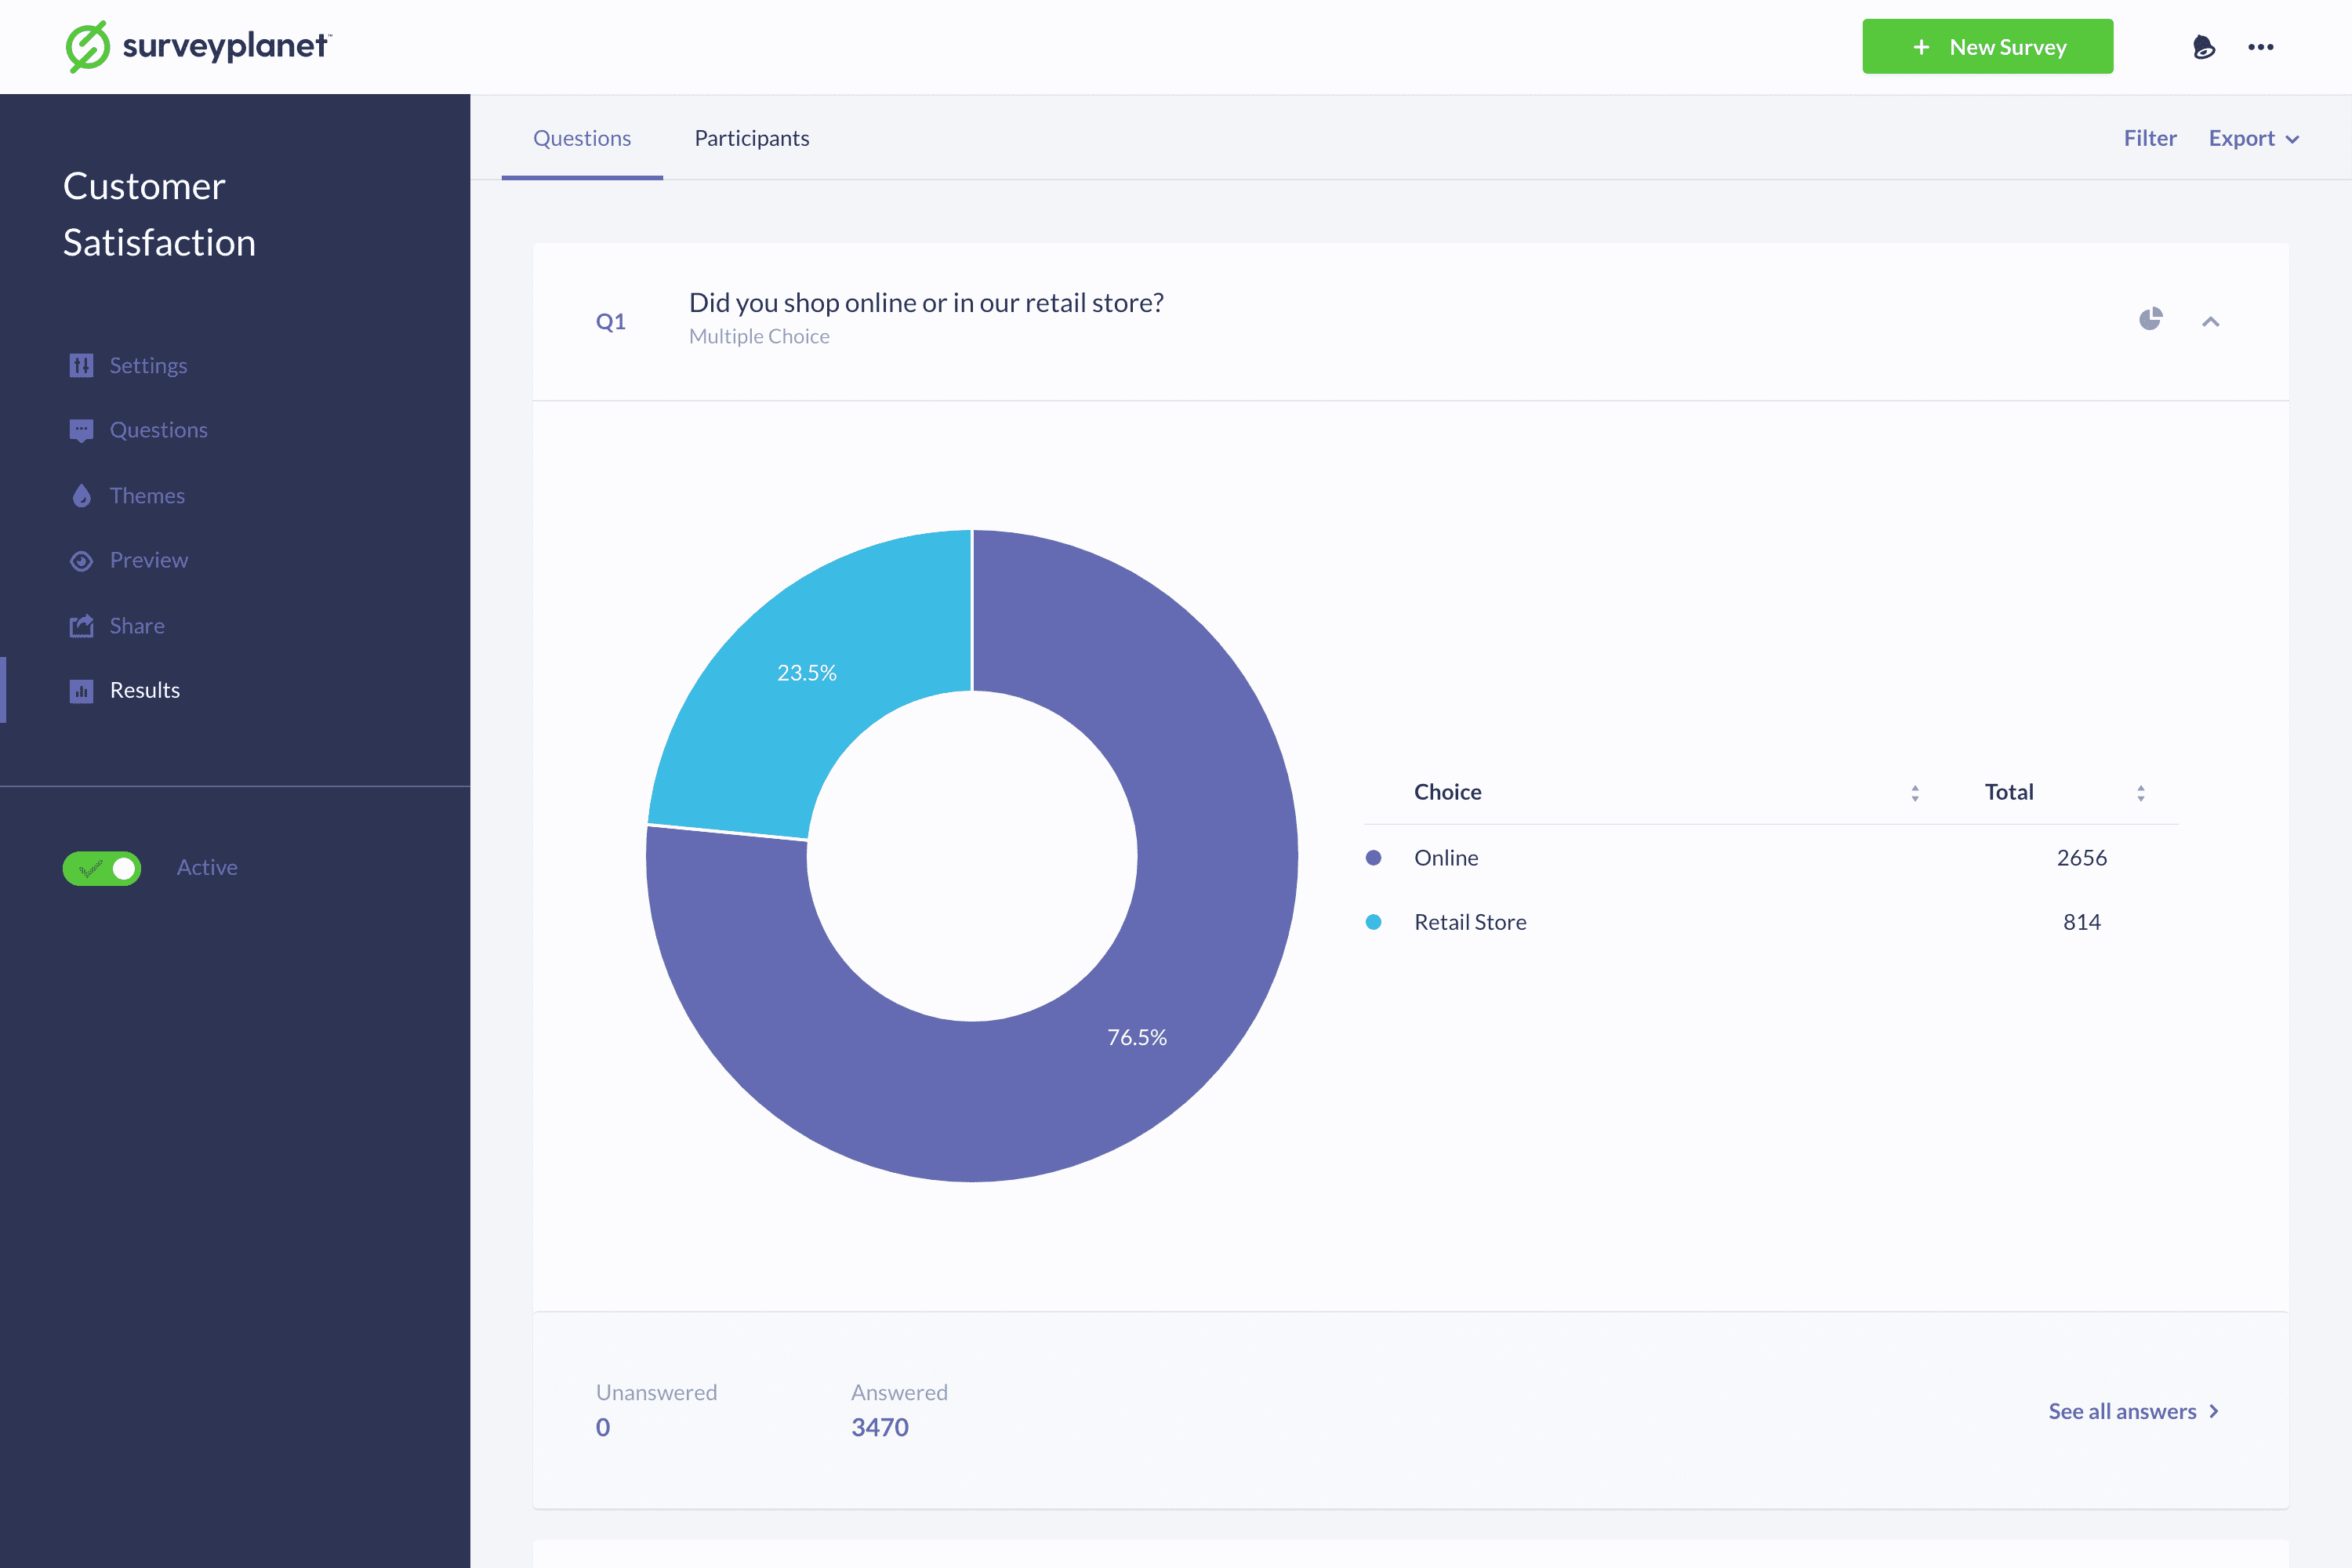
When you select the survey Results icon , Surveyplanet opens the Survey Results Summary page, where you’ll see a list of all the questions in your survey along with a summary of all the answers for each question. At the bottom of each summary, you’ll see the total number of times the question was Answered and Unanswered. To get more detailed information about each question, select Question Details.
Change chart type
Multiple Choice, Image Choice, Scoring, and Rating questions show a Pie chart by default. Pro users can select between four different chart views: Pie, Horizontal Bar, Vertical Bar, and Line. Free users see the Pie chart view only. To change to a different chart type:
- Select the Chart icon at the upper-right corner of the question.
- Select the type of chart you want to see.
- The chart in the middle changes to show your selection.
Hide single or multiple questions
Select the up icon to hide any questions you don’t want displayed. Double-selecting the up icon hides all of the questions. You can reverse this by double-selecting the now down icon to show all questions. Questions that are hidden aren’t displayed in the final export.
Multiple choice question summary
Multiple choice questions show the number of participants that selected each choice. The percentages are shown in the Pie chart view.
Essay question summary
Essay questions show the five most recent responses and the date they were submitted. To see all the responses, select Question Details.
Rating question summary
Rating questions show the number of participants that selected each choice. The Ratings column shows the Choices numeric value times the Totals. The percentages are shown in the Pie chart view. At the bottom of the summary the current Average Rating is displayed.
Scale questions summary
Scale questions show the Lowest answer, the Highest answer and the Average of all answers.
Form questions summary
Form questions show the five most recent responses for each input. The form labels are in the left column and the last submitted dates are at the top in the Latest Responses row.
Scoring questions summary
Scoring questions show the number of participants that selected each choice and the choices average score. The percentages are shown in the Pie chart view.
Range questions summary
Range questions show the Lowest and Highest answers, the Average Low answer and the Average High answer.
Date/Time questions summary
Date/Time questions show the Earliest date and/or time, the Latest date and/or time and the Average date and/or time.
Image questions summary
Image questions work the same as multiple choice questions. You will see how many times each image was chosen. The percentages are shown in the Pie chart view.